Data Cleaning in Power BI – Learn How to Do it in Minutes!
Data cleaning in Power BI is an important factor for proper and accurate data analysis and visualisation. Before getting into the precise steps of this process, let’s understand why it is necessary and how it can influence your decision-making process.
Businesses comprise structured as well as unstructured data that contains a lot of information about the different processes of the entire business. Both of these data forms contain piles of important information as well as unnecessary information.
If you build reports using the available structured and unstructured data, you may have to deal with redundant data that has no use for your business.
So, how can you get rid of such data?
Data cleaning in Power BI is the answer that lets you refine the data and filter out the useful information.
Since enterprises have to deal with huge amounts of irrelevant as well as relevant data. Businesses have to filter, prepare, and sanitise the data to make it useful for taking actionable decisions.
With the refined data, you will be able to make business reports for visual insights and statistical analysis using Power BI.
After importing the data, it is necessary to refine or clean the data to make visually appealing reports. Before getting into the steps of cleaning data, let’s understand its importance.

Importance Of Data Cleaning In Power BI
Importing the raw data into Microsoft Power BI isn’t enough to make powerful reports, as it contains a lot of errors, bugs, and unnecessary information.
Once you import the data from various data sources, you need to examine the data so that you can use it to create visuals and graphs. During data analysis, you may have to deal with the following issues:
- A column of alphabetical data with numerical values in it
- Various columns with null values and errors
- Duplicate entries in multiple columns
- Wrong demographic data in a particular column
- And much more
.png) If you process data with such existing errors, you will get a report full of incorrect values, mismatched information, wrong sales numbers, and similar other errors as well.
If you process data with such existing errors, you will get a report full of incorrect values, mismatched information, wrong sales numbers, and similar other errors as well.
With the cleaned data, you can build the desired and accurate reports that can accelerate your ability to make better and more actionable decisions for the business.
How To Clean & Transform Unstructured Data in Power BI?
The process of structuring the data in Power BI Desktop is a simple one. Before this, you need to ensure a few settings, which are:
- Open Power BI and click on the Transform Data button available in the Home tab.
 Image Source
- The data available in the Select Query will be displayed in the Power Query Editor.
- You can see the queris in the Queries Pane, available in table form.
- All steps you follow to transform the data will be recorded in the Query setting.
- Now, whenever the specific query connects to the specified data source, it will be applied through default steps.
Once you follow the above steps, it’s time to transform the data into useful form.
Streamline Column Header Data
In this case, the first step is to identify and correct the column headers and column names while ensuring the column is in the right place.
To help you understand better, we are considering two different files here:
- CSV file as a data source
- Data imported directly from a data source with irregular column and name data.
As you can see in the below image, the sample data is available for sales targets, categorised and sub-categorised by month.

As you can see from the image, the data is unstructured, and you will not be able to understand it.
Now, check out the below image, and you will find the columns without any names. But the below row contains the information. If we can rename the columns, we can eliminate the extra rows from the data. Recommended Reading:
Deleting Irrelevant Rows from Spreadsheet
As you can see from the data in the above image, there are a few blank rows and columns that should be eliminated from the sheet because there is no use of them. When you apply Power Query, the blank row can be removed easily.
- To do so, go to the Home tab and then click on Remove Top Rows from the Remove Rows drop-down menu.
Home tab > Remove Rows > Remove Top Rows

If you want to delete a column that contains data, you can do it using the same method.
- Go to the Home Tab and select Remove Column from the Remove Column drop-down menu. This is available on the second left of the Remove Rows drop-down menu.
Home tab > Remove Column > Remove Top Column
Changing the Name of Columns
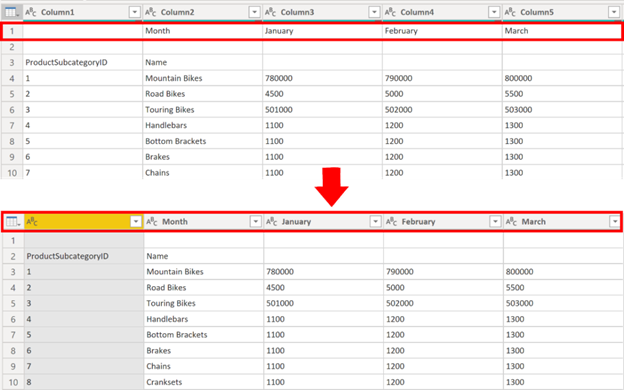
As we have seen the irregular data in the second image, you have noticed the columns with no names. Now, we are going to change the names of columns to make them relevant based on categories and sub-categories.
- At first, click on the table icon as displayed below and select the Use First Row as Headers button.

- Right-click on the header that consists of irregular names for columns and select Rename.
- Now, type the name you want to enter and press Enter to give the final command.

Unpivot Columns
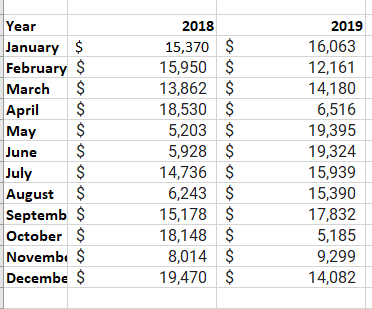
In simple words, unpivoting means transforming the rows into columns and vice versa. It is the most common feature of Power BI. You can use this to import data from any available data source, but most often users use this feature when they are required to import the data from an Excel file. Let’s understand this using an example of an Excel file.
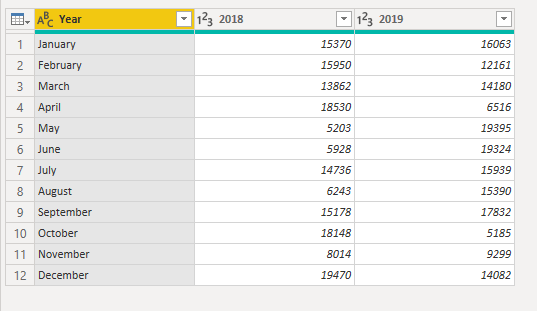
 When you import the data using Power Query, it will look like the below image.
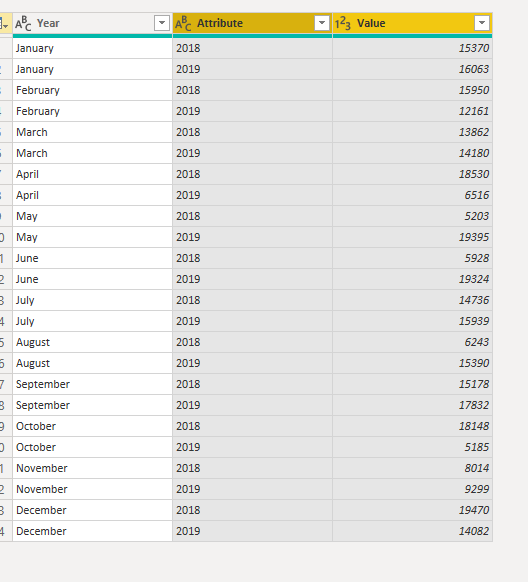
 This data shows revenue for each year separately, but it might be hard to make a report with total revenue for both 2018 and 2019. With this as a target, let’s see how your report will appear in Power BI:
 To create such a sales report, you need to rename the first column to month, then select the 2018 and 2019 columns, then choose ‘Transform’ tab, and finally ‘Unpivot’. Then, you can rename the Attribute and Value columns to Year and Sales Amount, respectively.
Conclusion
Data cleaning in Microsoft Power BI is important, and as per the above-given information, it is not complex at all. Even a novice user can follow the above methods to clean, structure, and refine the data to create visually appealing and useful reports.
It might be possible that you still have to deal with a number of other errors that come up during refining the data. In such a case, feel free to contact Dynamics Square to resolve any kind of issue related to Microsoft Power BI. Being in the industry for more than 12 years, we pretty much know the complexity of Power BI implementation and how to streamline it with the fewest possible resources.
See More: -
- Power BI for Mac: How to use Power BI on Mac Devices?
- Top 13 Reasons to Implement Power BI For Your Business
- Why Power BI for your Business?
- Power BI Architecture: 7 Components Explained
- Generate Interactive Power BI Reports
- Data Cleaning in Power BI? Learn How to Do it!
- Power BI vs Tableau [A Practical Comparison]
.png)