What is Copilot in Power BI? Data Analytics become Limitless
Microsoft has introduced Copilot in Power BI along with some cutting-edge functions to enhance data analytics capabilities. The Microsoft Copilot has made Power BI more powerful and capable than ever.
Leveraging the functionalities of Copilot, Power BI can help you utilize the full potential of your data through intelligent insights. You can now analyse, visualise, and utilise the data available in Power BI with Copilot using the natural language prompts. Based on your prompts, you will get useful insights with minimal effort.
You can simplify asking questions or entering commands to let Power BI build a responsive report using the limitless Copilot capabilities of next-generation AI. However, you can further give commands to fetch particular kinds of information out of a Power BI report.
Even Copilot empowers Power BI to retrieve the hidden information out of the encrypted data that can influence the usefulness of the report. If you are having difficulty understanding a particular piece of information or a report, Copilot empowers you to create a summary of complex information in a single prompt.
The integration of Copilot with Microsoft Power BI works on a simple concept: you need to describe the question to get the best possible answer. You can simply ask a question, and Copilot will give you the answer within a few seconds, utilising your data.
The Power BI interface has become simpler and more flexible to let everyone use the solution to the fullest. It’s like you are interacting with ChatGPT or Google Gemini to find your answers.
Role of Data in Modern Businesses
Data has become an essential asset of an organisation, whether small or big. Everyone wants to capture and utilise it for growing businesses and increasing revenue. The entire process of utilising data isn’t as simple as it looks.
You cannot process the huge amount of data and fetch important information out of it using just your ERP or CRM solution. However, you will need a specific advanced data analytics and visualisation tool that empowers you to capture the data, filter the useful information, and utilise the data using interactive data visualisations.
Microsoft Power BI is one such solution that offers cutting-edge data analytics capabilities embedded with AI to power up the entire process. With embedded AI (artificial intelligence) and BI (business intelligence) technologies, Power BI visualises the data and caters it to the users in the form of understandable reports and customisable dashboards.
Nowadays, businesses are working hard to capture data and investing more resources to utilise it in every possible way. Integrating Power BI with Business Central (ERP) eliminates all the efforts a business makes to analyse and visualise data. The integration process is easy and can be executed with the help of a Power BI implementation expert (Dynamics Square).
However, the entire cost and time of the entire implementation depend on your business requirements and the need for a customisable report. Despite being cost-effective, it comes with powerful capabilities for connecting all data, turning data into insights, and providing better team collaboration opportunities.
With the changing global scenarios of the market, Microsoft introduced Microsoft Fabric and Copilot in Power BI to boost its abilities and offer an all-in-one solution for data visualisation requirements.
Microsoft Fabric and its role in Power BI
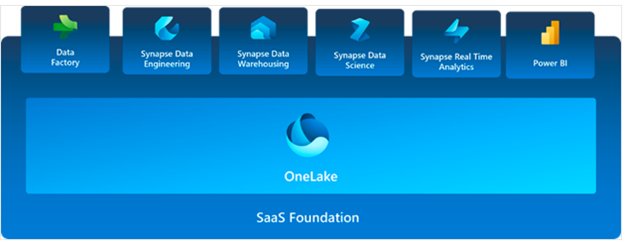
Microsoft Fabric is a complete data analytics solution capable of managing the data, from collection to visualisation. It enables businesses to connect different services to offer a collaborative data analysis approach. Such services include data lakes, data engineering, and data integration.
A business consists of different kinds of data that we collect from different sources. Managing and unifying such amount of data is a time-consuming process that requires a lot of resources.
Microsoft Fabric eliminates the need for resources and infrastructure as it connects and unifies data collected from different sources without any hassle. It even empowers you to analyse such an amount of data leveraging AI and SaaS (software as a service) technologies.
With a single integrated work environment, you can connect your applications, including Power BI, Azure Data Factory, Azure Synapse, and Synapse Data Engineering, with One Lake to bring data together. With the collaboration, you can use different components of Fabric, like Data Engineering, Data Factory, Data Warehouse, Data Science, and Real Time Analytics for seamless data analysis.

Microsoft has now enabled users of Power BI to utilise the capabilities of Fabric. With its unified data analytics capabilities, Microsoft Fabric empowers the users of Power BI in different ways, like:
- Reduced Development Time
OneLake or Fabric’s data lake empowers users to simplify the complex process of collecting, building, and maintaining data into separate sections of Power BI reports. With the centralised database of data, reports, and dashboards, you can access data from anywhere and collaborate with any team member for maximised output.
- Enhanced Data Governance
Fabric comes with different data governance policies to adhere to the authenticity of the data lifecycle. It ensures the delivery of accurate and reliable data within Power BI reports, eliminating any chances of errors and wrong data insights. It will standardise the information or data available to all users of different departments.
- Accelerated Team Collaboration
OneLake allows users to access the data directly from the central repository of Power BI to reduce manual ways of sharing and updating information across team members. All employees at different levels can easily collaborate with one another, accelerating business efficiency and team productivity.
- Faster Data Iteration on reports
Copilot in Microsoft Fabric is capable of data iteration, like data connections, personalised insights, identifying relationships, and writing SQL queries. It allows users to strategically build reports for better data impact.
- Cost Optimisation
Microsoft Fabric comes with a capacity model that allows Power BI Premium users to use the existing capacity for other Fabric services as well. With this licencing model, you don’t need to purchase a separate licence for different services or solutions.
Copilot in Microsoft Power BI
Microsoft Copilot comes with generative AI that empowers users to use transformational power to utilise the data to its fullest. With generative AI, Power BI can create, update, and modify reports automatically by giving relevant prompts to the Copilot.

The way to access Copilot is simple, as it is available at the bottom right corner of the Power BI screen. You need to click on the Copilot pane and enter the required prompt. Like, fetch the data, generate a report, build a summary of a report, and a lot more. You can even transform the data into a format you would like to consume. You can convert the paragraph into bullet points, or in questions and answer form, to utilise the data properly.
Among the numerous functions of Copilot in Power BI, some of the major factors are listed below:
• Create an Outline of a Report
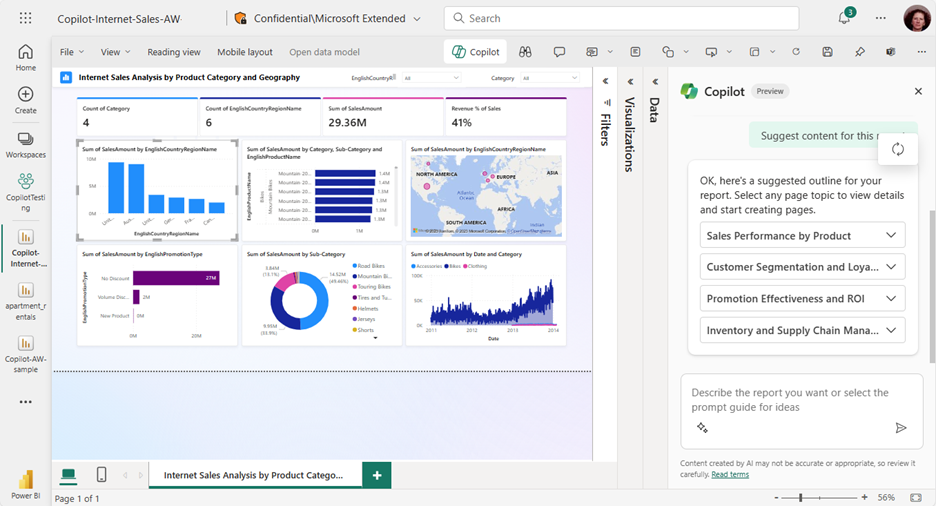
Copilot can create an outline of a report based on suggested information. However, you need to enter a concise prompt for it. The accuracy of the prompt will determine the authenticity of the outline you want to create. Based on your prompt to Copilot, you will get the starting point from where you have to start analysing data. Once it creates the outline, you can modify the data based on your requirements.
• Create Exciting Visuals
With Copilot, you can create text-based visuals to analyse the data on the report canvas. Such visuals will suggest prompts to let you analyse and visualise the data based on different parameters.

• Generating Summary of Report
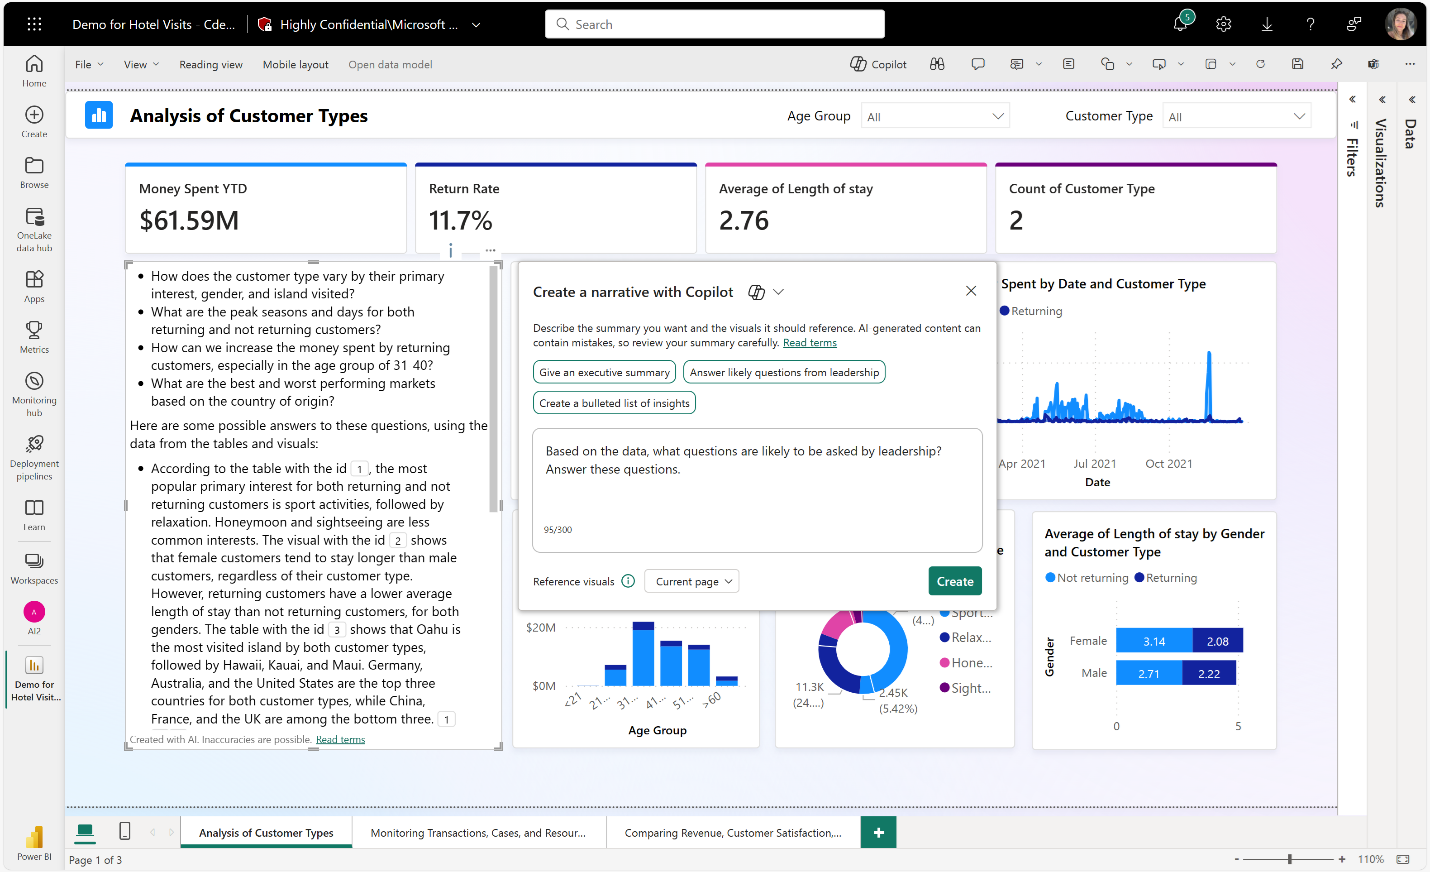
Using a simple prompt, “generate summary of the report,” will empower Copilot to generate a simple summary of the entire report within seconds. Also, you can generate a summary of the report even if you don’t have edit access.
Based on your requirements, you can generate the summary in bullet points or in paragraphs to easily utilise the data as per your taste.

As you can see, with the prompt "summarise visuals on the page,” you can avail yourself of a summary of the data available in the form of visuals.
• Write Descriptions for Semantic Model
You can enable Copilot to add or write descriptions for semantic model measures. When people build reports using a semantic data model, they can collect the name, description, and other details of the measures. Such information is an essential element for semantic models.
How can Dynamics Square help you with Copilot in Power BI?
Copilot is a powerful generative AI solution that comes embedded in Power BI to offer intelligent and advanced data analytics capabilities. As we know, AI is limitless, so the Microsoft Copilot. It eliminates a lot of effort and pushes a business towards automation as well as simplicity.
To explore the full capabilities or to utilise Copilot to the fullest, you will need a Microsoft Solutions Partner, like Dynamics Square, who has years of experience in implementing Power BI in different businesses.
With a proven track record, the expert team at Dynamics Square is available to help you resolve any issue related to the Power Platform. In case of need, feel free to write us an email at info@dynamicssquare.co.uk or call us at +44 207 193 2502 for instant support.
