How To Understand Sales Insight Using Power BI & Dynamics 365?
Sales are known as the lifeblood of a business. It fuels the business, supports operations, and strengthens the entire business to keep it growing. During the sale process, businesses collect a lot of customer data that is a bit difficult to consume manually.
In such a scenario, ERP (enterprise resource planning), CRM (customer relationship management), and data reporting solutions come into existence.
If the process of collecting sales data solely depends on these solutions, you are losing a lot of quality data responsible for a lot of revenue. To survive in the modern world, you need to understand and utilise sales insights.
Also, you can understand the sales insight using Power BI and Dynamics 365—the most powerful business solutions to help a business achieve rapid growth. But, before getting into the depths of sales data, let’s understand Power BI and Dynamics 365.
Microsoft Dynamics 365; a Powerful Suite to Streamline the Entire Business
Microsoft Dynamics 365 is a suite of powerful applications consisting of CRM (customer relationship management) and ERP (enterprise resource planning) applications that can control and manage all business processes. Accessing automation using the latest technologies like AI, ML, and BI, the D365 apps cover all departments and offer a controlled and centralised user interface.
With the implementation of Microsoft Dynamics 365, the overall costs are lowered while operational efficiency is enhanced. Also, it offers a responsive and interactive user interface to make a particular operation easy to operate from any device.
The Microsoft Dynamics 365 applications include pre-built functions, allowing you to use all of the features and capabilities without difficulty. Nonetheless, you can optimise existing operations to boost overall growth and elevate your business’s growth.
Microsoft Power BI: Visualise the Data to Efficiently Use it
Microsoft Power BI is a data analysis and visualisation tool capable of offering interactive data using graphical visuals like graphs, bars, charts, and more. It lets you understand the large sum of data in no time while offering you true insights in real-time.
Later, you can use the data to make actionable decisions that result in maximised sales and revenue.
When you feed data into Power BI, it provides you with seamless options for creating personalised reports and dashboards based on various types of data and parameters.
Based on AI, ML, and big data, Power BI collects the data from different sources to help you analyse, collaborate, and share results with full accuracy. Plus, you can easily integrate Microsoft native and third-party apps for ease of accessibility and increased performance.
Power BI pricing comes with different plans, including Power BI Desktop, Power BI Pro, and Power BI Premium. Employees can share data with other team members with a single click for successful actions, depending on the type of Power BI licensing.
Understanding Sales Report
Understanding and utilising the sales report is a vital element each salesperson must know. The better they understand all data and metrics, the higher their sales figures will be.
Also, you must know the procedure to generate interactive sales reports before going further.
At first, you need to upload the sales data into Power BI. You can import the report while accessing the Import data from Excel option available in Power BI.
After importing the data, you can edit it in the Power Query Editor by deleting, adding, or modifying it. Keep the important columns and remove the unnecessary data.
Once you prepare the data, you are ready to build visuals.
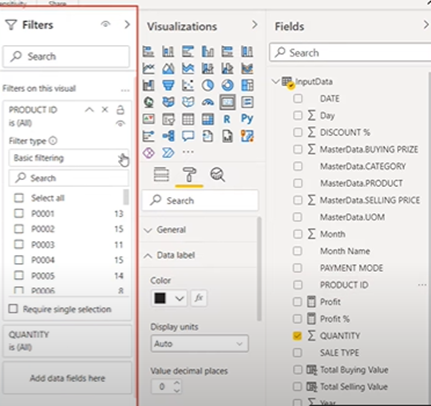
Using the Fields menu on the right, you can build the desired visuals and modify them based on your requirements.

After visuals, you will get your data in easy to digest manner.
 In the above image, you can see the CY sales and YoY sales growth%. This data gives an accurate analysis of sales to date as per the uploaded data.
In CY Sales by Category, you can check the sales number based on the added category. Whenever, you click on any category, the entire visual will change accordingly.
Nonetheless, you can examine the growth rate and sales by product. If you find the percentage or the number low as compared to your expectations, you can build strategies to enhance the performance or get more sales to achieve the target.
If a salesperson is strong at making sales in one category but weak in another, the sales manager can exchange the open accounts with other team members so that more chances of making sales can be increased. Also, a salesperson can focus on one category after getting the data.
Sometimes, the sales team has accounts that can add more value than various other accounts put together. With this insight, a salesperson and manager can focus on such accounts while making more opportunities for conversion.
How can Dynamics Square help you enhance your sales?
The proper utilisation of sales data can skyrocket a business’s revenue with no extra cost. If you are having issues exporting the report to Power BI or creating proper visuals, the team at Dynamics Square is available to help you out.
Since the last 11 years, we have been helping businesses like yours enhance revenue while reducing the number of issues and problems they face on a daily basis. Our certified Microsoft Dynamics 365 consultants can resolve any kind of issue you are facing while implementing CRM sales data with your existing Dynamics 365 system.
Whenever you feel stuck with Power BI, just pick up the phone and contact us at 0207-193-2502 or you can directly write us a mail on info@dynamicssquare.co.uk .

.png)